Jeremy Beckham's understanding of COVID demographics is lacking
Jeremy Beckham accuses the New York Times of a lack of rigor with regard to COVID data analysis. His critique is even worse in that regard
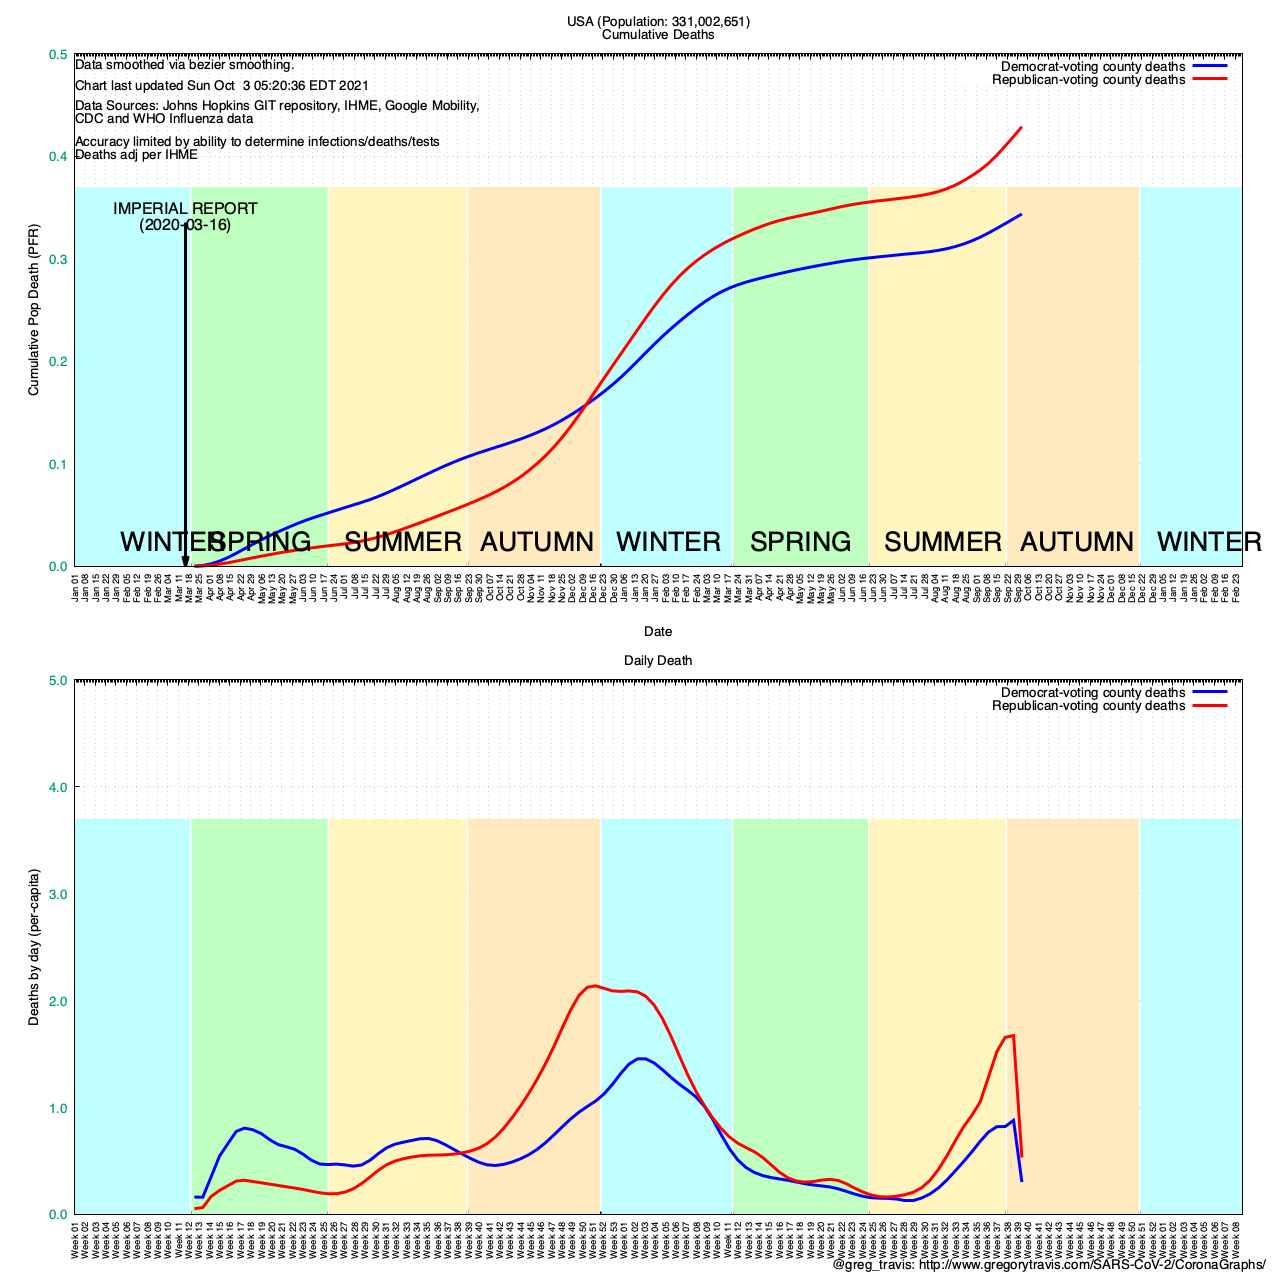
Recently the New York Times ran a piece regarding the correlation between COVID death rates and county-level partisan affiliation. In short, using data compiled by healthcare advocate Charles Gaba (@charles_gaba), the piece concluded that those counties which had gone for Trump in 2020 had higher death rates than those counties which had gone for Biden.
This is entirely true. If we look at voting percentages for either candidate at a county-wide level, that is exactly what the data says — particularly if you look at the COVID reconstruction period beginning in the fall of 2020:
Utah-based government transparency advocate (who isn’t?) Jeremy Beckham (@JeremyBeckham) subsequently wrote a rebuttal to the Times’ piece. The rebuttal was picked up by journalist and First-Amendment advocate Glenn Greenwald and published on Greenwald’s “Outside Voices” substack newsletter.
Beckham’s objections are:
1. The NYT times piece did not normalize for age differences between Republican and Democrat-voting counties and everyone knows that a) age is a huge factor in COVID death rates and b) Republican voters are older than Democratic voters.
The first assertion is not actually true and I’ll go into why below. The second assertion is true but only by a technicality. Voting participation rates skew very highly towards older voters of either party and the net result is that the average age of a Republican voter is less than two years older than the average age of a Democratic voter.
2. There is a large disparity in rural/urban voting patterns with rural counties overwhelmingly going for Trump and urban counties going for Biden (true). And that differences in health access and outcomes between rural and urban counties could explain the difference.
They do not. Again, I go into why below
3. This is all a plot by liberals to paint Republicans / Trump voters as idiots.
This may be but it’s irrelevant. The primary take-away from the Times’ piece is that death rates are higher in Republican-voting US counties than in Democratic-voting US counties.
Countless polls, surveys and media reports over the pandemic tell us, in Republican’s own words, that they do not believe the pandemic is real, they do not believe that NPIs such as masks and social distancing are effective, they think children and workers should be back in congregate settings such as schools and workplaces, etc.
In other words, liberal plot or not, Republicans are telling us with their own mouths and keyboards that it’s a fake and they are not inclined to do anything to protect themselves against something that they don’t believe exists or don’t believe is a hazard.
On the first objection, that the piece was not normalized by age, Beckham commits exactly the sin of which he accuses the New York Times: an inability to account for cofounding variables.
Yes, it is true that COVID death rates rise with age. This is not something that is unique to COVID — it is true of virtually ALL diseases. The average age of a cancer death is 70. The average age of a heart disease is in the mid 50s.
The chance of dying of anything rises with age. Nothing special here with regard to COVID.
What the observation (that COVID deaths from infection rise with age) overlooks is the fact that COVID infection rates decline with age. And that it is impossible to die of COVID disease unless one is first infected with the SARS2 virus that causes it.
I have been looking into this paradox for quite some time. About a year ago I developed a system that would help me try and understand the effective rate of NPI (non-pharmaceutical interventions) use (masks, etc.) vs. what I called the statutory rate.
Statutory NPI use is best understood as the various “statewide mandates” for mask use. Effective NPI use is what people are actually doing.
Various attempts have been made to try and quantify statutory NPI rules — the Oxford Stringency Index being among the best known. And many critics of statutory NPIs (“lockdowns”) have pointed to the lack of correlation between statutory stringency and COVID death rates.
In the United States mandates are entirely unenforced. I cannot think of a single individual who has ever been fined, arrested or jailed for failing to wear a mask for instance. Which makes looking at statutory mandates as a measure of how much NPI is going on virtually worthless.
I needed to find a way to measure effective NPI use. To do that I first needed to analyze COVID statistics at the finest grain level that I could and that turned out to be county-level COVID infection and death numbers.
Like many, I initially assumed there would be a strong correlation between average county age — how many older people a county had — and COVID death rates.
But, surprisingly to me, I found no correlation between median county age in the United States and COVID mortality.
In fact, I found a slight signal of the opposite.
This data in this map is used by my software to normalize for things like race and age. The grey/light blue counties are those in the US with a higher than national average of those 65 years and over — the exact places where you would expect there to be very high rates of COVID mortality.
Pay particular attention to the Pacific Northwest, the Great Plains, Florida, Vermont, New Hampshire and Maine in this regard.
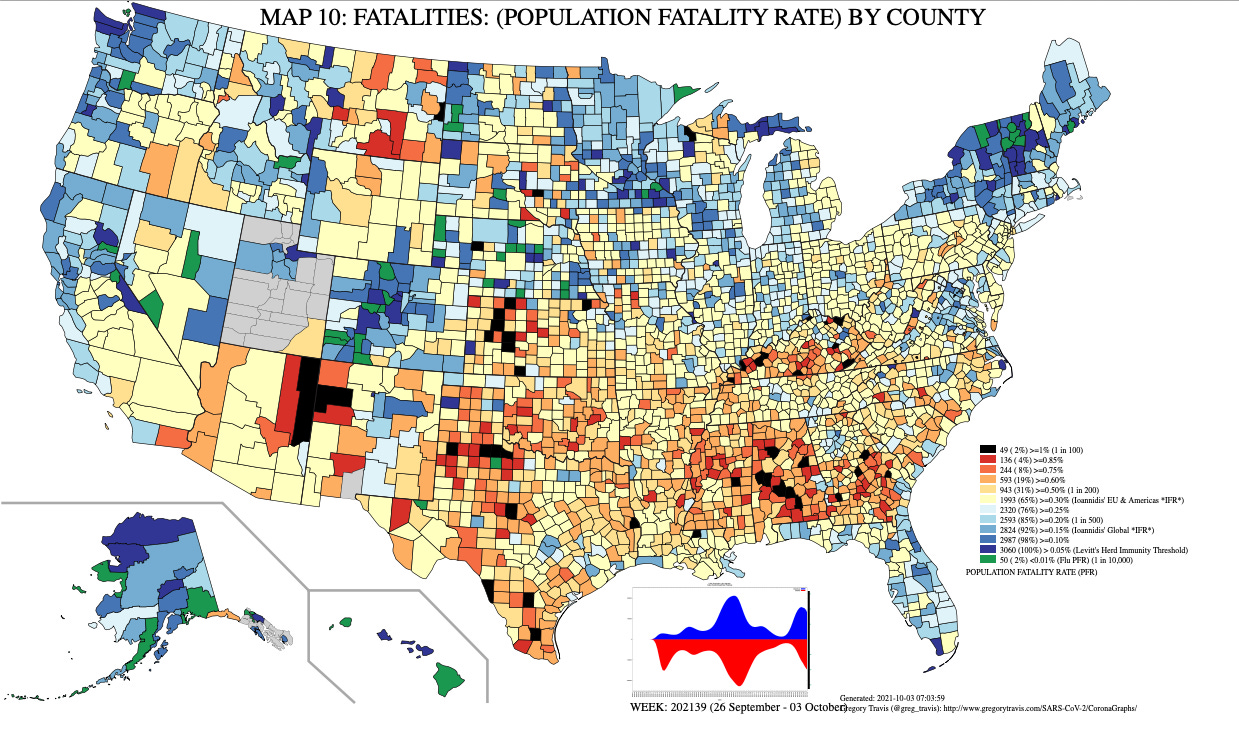
Next let’s look at another map I produce. This is the cumulative COVID death rate by county in the US since the start of the pandemic:
Note that here the “old” parts of the US — coastal Florida, the Pacific Northwest, Great Plains, Vermont, New Hampshire, Maine — all have relatively low levels of COVID fatalities.
And some of the highest fatalities are found in very young counties, like McKinley County, New Mexico which has not only a record-setting (for the nation) low average age, but also a record-setting high COVID death rate.
Again COVID death rates are a direct function of COVID infection rates. You cannot die of COVID if you are not first infected with COVID.
We know why older people are more likely to die of a COVID infection than younger people: because older people are more likely to die of anything than younger people.
But why are older people less likely to become infected than younger people? And, remember, you cannot die of a COVID infection unless you are infected.
Older people are in general much better equipped to avoid infection in the first place. Two factors are largely behind this:
1. Older people are less likely to spend the majority of their days in congregate settings such as school or in-person office work. These are the places where a COVID infection is most likely to be acquired. The simplest way to understand this is to understand that indoor, poorly-ventilated, spaces are where you get infected.
And school classrooms as well as work offices are textbook examples of indoor, poorly-ventilated, spaces
2. Older people are self-aware that they are at a higher risk of death following a COVID infection and therefore do more to shield themselves from infection in the first place. This is something called “risk homeostasis” — individuals each have a given level of risk they will tolerate and will make lifestyle adjustments whenever they perceive that their individual level of risk has moved outside (either up or down) their own risk tolerance preference
As older people perceive their risk from a COVID infection as much higher than do younger people, older people adjust by reducing their risk exposure until their perceived risk falls back to where they as individuals will tolerate.
They have higher rates of NPI use — masks, social distancing, etc. precisely because they perceive themselves at risk from infection.
With regard to the disparity between rural and urban areas in terms of access to health care and its effects on outcomes, the data simply do not support that.
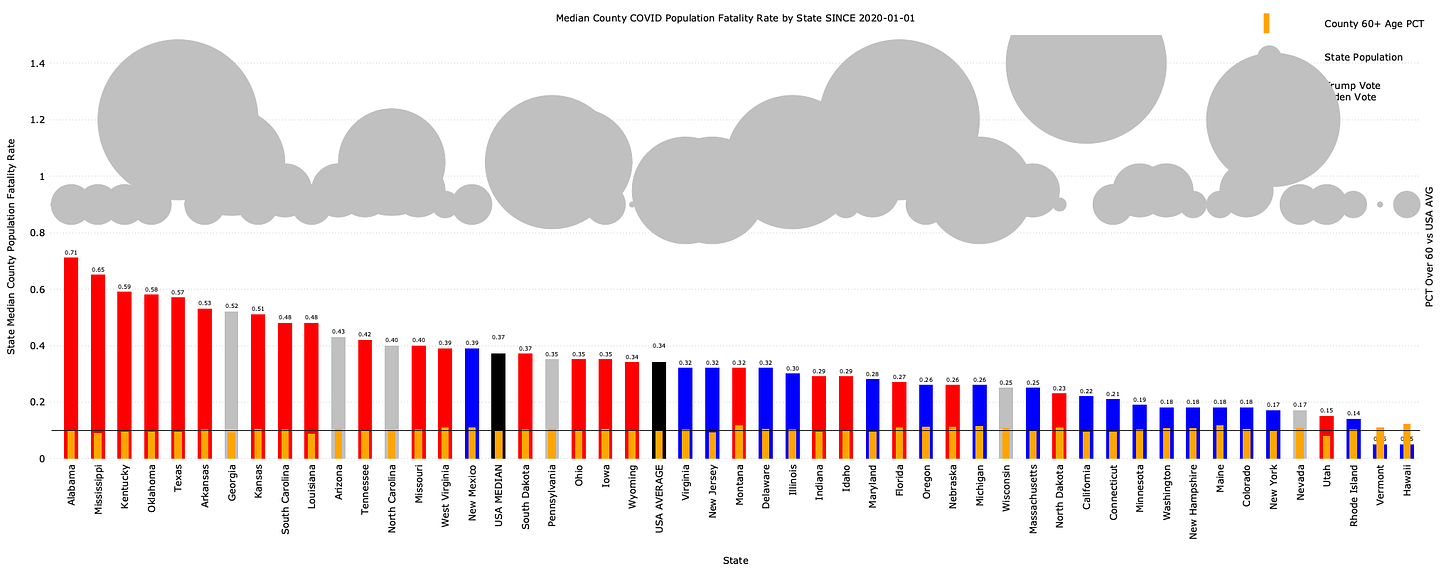
For instance, rural Vermont has the second-lowest COVID death rate of the US states.
Urban New Jersey has the highest. The largest US cities — New York City and Los Angeles (county) have staggeringly high COVID death rates.
As far as I can see, the disparity in healthcare access and outcomes between rural and urban areas is largely, dare I say it?, an urban myth.
Yes, rural counties tend to be older than urban counties. Yes, the general health indicators in rural counties are worse than in urban ones (less exercise, more crap food, etc.). But it turns out that doesn’t matter much.
The United States has the most highly rationed health care system in the “developed World” (OECD). However, there are two major groups that are excluded from pervasive health care rationing: Military Veterans and those old enough to qualify for Medicare.
The great and tragic irony here is that older rural Americans have significantly greater access, not less, to health care than young urban Americans.
Beckham’s final point: This is just payback from the liberals and not indicative of the real situation.
To that I say: instead of trying to divine motives, let’s simply take people at their word.
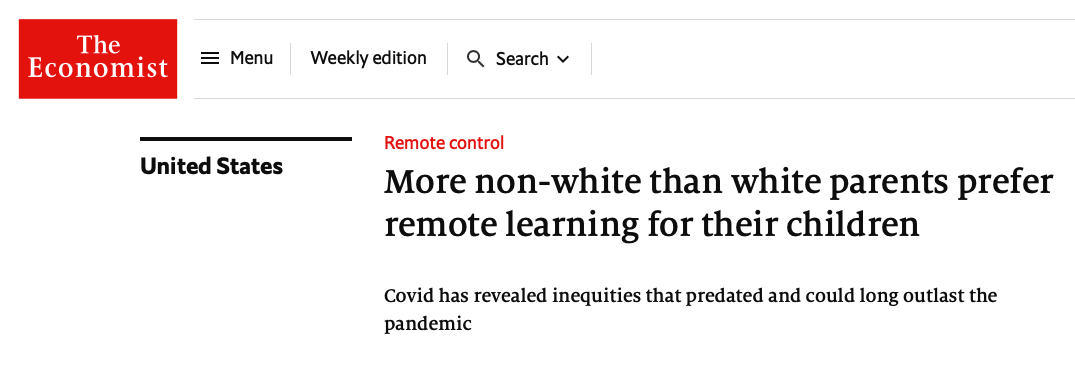
The overwhelming word among Republican voters is that they, by their own reporting, are much less likely to use NPIs such as masks, less likely to support online schooling (white Republicans when surveyed are several points less likely to support online schooling than minorities), etc.
When asked directly, self-identified Republicans and Trump supporters will tell you that they:
Don’t believe in social distancing
Don’t believe in masks
Don’t believe COVID is a serious disease
Believe kids should be back in school
Are extremely vaccine hesitant
You would not be wrong to look at that list and conclude: “That looks like a love letter that someone wrote to COVID, begging to become infected.”
It does not matter if liberals are looking for payback. The data is the data and, when asked, Republican Trump supporters will openly admit that they engage in risky lifestyle choices that make them significantly more likely to become infected — and then to die — than do Democratic Biden supporters.
What is surprising is that so few are willing to accept this at its face value.
Charles Gaba has done some truly remarkable work on this and is in a much better position to understand the data than most. Others, including myself and individuals such as Dr. Jonathan Douglas (@JonathanCOnP) have been looking at the same data for a long time and came to the same conclusions as Gaba.
And that conclusion is: When we discern effective NPI use (vs. statutory) by looking at political identity at the US county level the conclusion is clear: Those who dismiss masks, social distancing, online school, etc. as ineffective are dying from COVID at a rate significantly higher than those who don’t.


I agree with your overall point but I'm really curious about your finding of no correlation between median county age and mortality. I've been doing a lot of analyses of the data from just the state of Ohio and within Ohio, a linear regression (weighted by county population) between county death rate and percent of county population > 65 years old has a correlation with R^2 = 0.63 (p < 1e-15). (The correlation is considerably stronger with percent over 65 than with median age but also quite strong with median age.) By contrast, death rate vs. Trump vote percentage has R^2 = 0.18 (p < 1e-4). This makes me wonder if when looking across different regions of the country there are other confounding factors that are masking the relationship between county age and mortality. Because within the single state I'm analyzing (which might eliminate some of the confounding factors) the relationship between the age of a county's population and its COVID death rate is just incredibly strong.
But if we limit the analysis to deaths since the end of June 2021, the results flip - the correlation with percent over 65 has R^2 = 0.16 (p = 0.00013), with Trump vote percentage R^2 = 0.43 (p < 1e-11). In a multivariate linear regression against both, Trump vote has p < 1e-8 and percent over 65 has p 0.086. Supporting that since the vaccine rollout, the major determinant of county death rate switched from population age to Trump support.
what about Nursing home deaths? At the beginning those were one of the biggest sources of deaths, after they instituted rigorous NPI's it went way down, and with vaccines even more so but how big was it initially?